If you are new to photography or photo editing, there may have been times when you were editing a photo and decided to bring down the highlights slider as they were completely blown out in some areas. While doing so, you realized that even though the image looks better than before, you’re not sure if you should continue to work on it. Where should you stop to make sure that the image looks… normal? or you may wonder what is histogram in Lightroom.
What is Histogram?
What if there was a way that Lightroom could show you that you have extremely overexposed areas in your image that need to be adjusted or an indicator that could tell you that the shadows (or highlights) aren’t clipping anymore so you can stop moving the slider?
Well, Lightroom does have such a tool and it’s called a histogram. In simple words, a histogram is a graph on which every single pixel of the image has been plotted. Being familiar with a histogram helps you edit images in a way that you don’t lose any details in it.
Where Is Histogram Located in Lightroom?
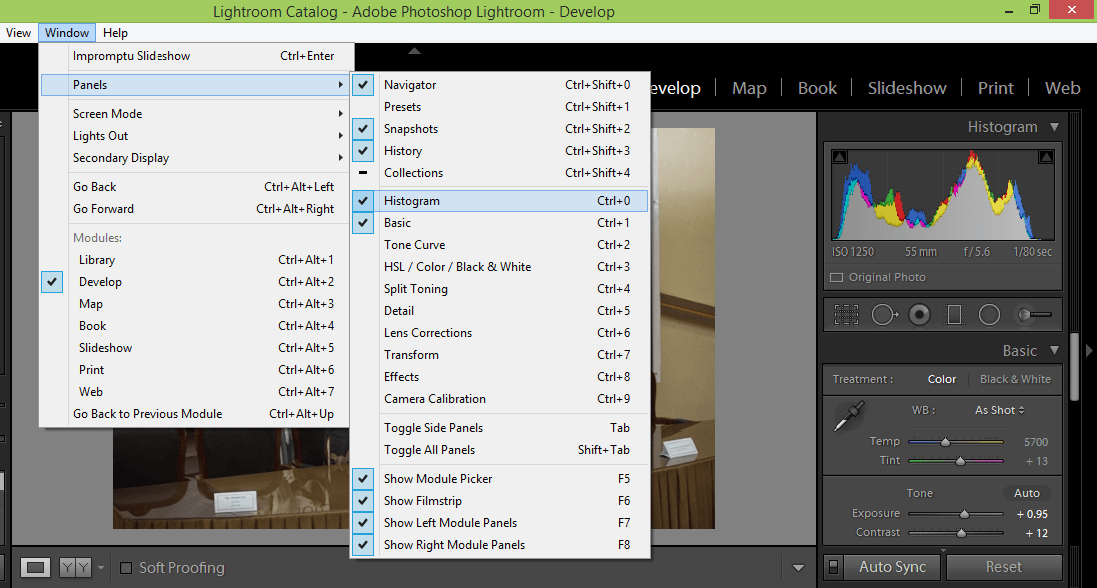
The histogram can be found in both the library and develop modules at the top of the panels on the right. The version in the develop module is more interactive than the one in the library module because it lets you adjust your images directly from the histogram and also shows you any clipped pixels that the image might have. If you open Lightroom and cannot see the histogram for some reason, you can view it by going to Window> Panels> Histogram or by pressing Ctrl+O/Cmd+O.
What Does Histogram in Lightroom Show?
The histogram is a graph of all the pixels in your image and typically, the pixels are spread over the whole width of the histogram where the left side shows the shadows and the area on the right shows the highlights. So, if the histogram is concentrated in the middle with barely any pixels on the far right or left, it means that it has hardly any strong highlights or shadows and mostly contains mid-tones resulting in a dull image with low contrast.

The histogram also show if you have any clipped pixels; clipping is the loss of detail in pixels which means the shadow is so dark that it has no detail and is completely black or the highlight is so bright that it is completely white.
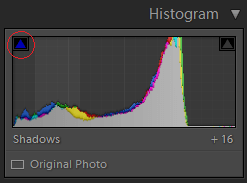
Right above the histogram, there is a triangle in a small square on the left, which is the shadow clipping indicator while the triangle on the right indicates highlight clipping. Whenever you have any clipping in either the shadows or highlights, the respective indicator becomes white. Then, you can either click on the indicator or hover your mouse pointer over it and it will show you the clipped pixels in the image.
Is There a Right Histogram?
There are no perfect right or wrong histograms and it all depends on the kind of picture that you’re working with. Typically, if your histogram has a gap on either the left or right side, it means that most of the pixels in your image are either white/highlights or blacks/shadows. In this case, you may check for clipping and adjust it but you can’t say that it is a bad picture or that the picture has problems just because most of the pixels are concentrated on one side.
Let’s say that you have taken a picture of a black dog in front of a black gate. If you look at the histogram, most of the pixels will be on the left with a gap on the right. You don’t really need to worry about fixing it because that’s just how the image is and it is not a wrong histogram. All you need to do is make sure that the image is exposed correctly and that there aren’t a lot of pixels getting clipped; adjust for that (and for the contrast if you want) and you’ll be good to go.
Moreover, you might not need to adjust every single pixel for clipping if it’s not feasible. Again, it all depends on the kind of picture and where the clipping is occurring. So, for example, if your subject is a little boy and most of the frame is occupied by him with only a tiny area of the background getting clipped, you don’t need to sacrifice on the quality of the editing of the boy’s face just to save those few irrelevant clipped pixels. In the end, it’s up to you to decide whether you want to adjust the pixels or leave them as they are, depending on the image.
Using the Histogram Directly to Adjust Photos
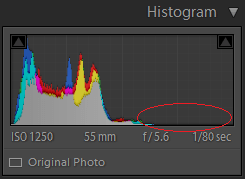
The histogram is divided into five different sections which correspond to either one of the following characteristics of the image: blacks, shadows, exposure, highlights and whites. Normally, the area right below the histogram displays information about your image but if you hover your mouse pointer over it, this information will be replaced by the name of the section depending on where the pointer is hovering. The slider corresponding to that section will also be highlighted in the Basic panel. Moreover, the mouse pointer will turn into a two-directional arrowhead indicating that you can move it either way by clicking.
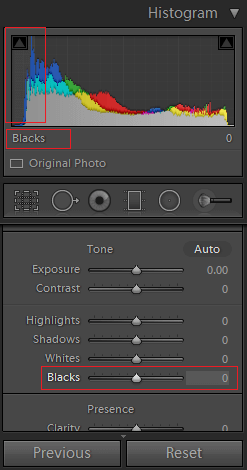
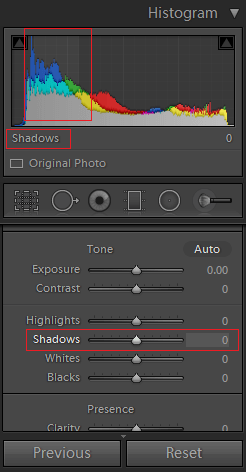
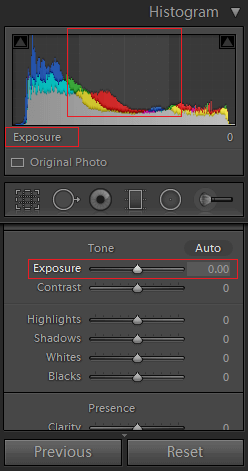
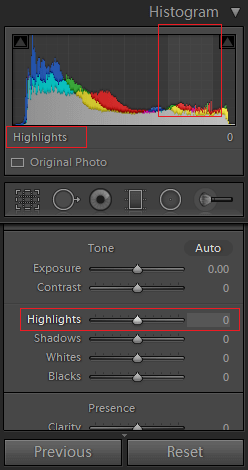
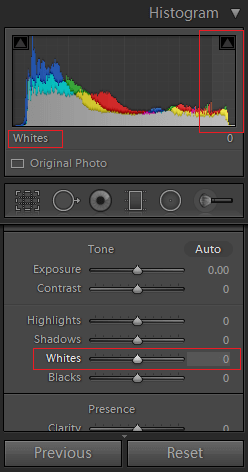
There are two ways to adjust any of the five characteristics; you can either use the sliders, or you can click on the section on the histogram and move the mouse left or right to change the values. If you’re using the histogram to adjust your photos, you will notice that as you move the mouse, the slider corresponding to the section also moves. So, in short, you are just moving the sliders directly from the histogram instead of scrolling down and moving them.
Color Histograms
If you’re working with a colored photograph, there will be parts in your histogram with various colors. These correspond to the red, green and blue channels of your image. So, there is a red histogram, then on top of it is a green histogram, and over it is the blue histogram. The other colors that you see are the overlapping of two colored channels. Then, there is a gray histogram right at the front which is like an average or a composite of all the channels. These colored histograms have pixels of the respective color plotted on it.
Moreover, you’ll notice that sometimes the highlight and shadow indicators above the histogram also turn into different colors which shows that there is clipping only in that specific channel. For example, if the shadow clipping indicator has turned blue, it means that there is clipping in the shadows but only in the blue channel.
To Sum It Up…
The histogram has many uses; it is a graph that tells you whether your image majorly consists of highlights, shadows or mid-tones. You can also use it to see if the image is well-balanced or if it has high or low contrast. It is most commonly used to check if you have any clipped pixels in your image and it helps you decide if you need to make adjustments to your photographs or correct any problems with it. If you are someone who regularly edits images, familiarity with the histogram and knowing how to read it can be extremely helpful in identifying problems and making quick fixes to your photographs.